
I recently wrote a children’s book called D is for Data: The ABCs of Data Analytics. This is the third in a series of behind-the-scenes, companion articles that will dive a little deeper into each term. We’ll explore the illustration used to define the term, how the word is used in the data world, and other interesting (to me) trivia.
In the not-so-distant past, there was a guy named Tyler Vigan who made a hilarious web site called spurious correlations. It showed absurd correlations like the “divorce rate in Maine” and “per capita consumption of margarine.” You can see from the graph below that these two metrics are highly correlated based on the shape of the graph. They change together.
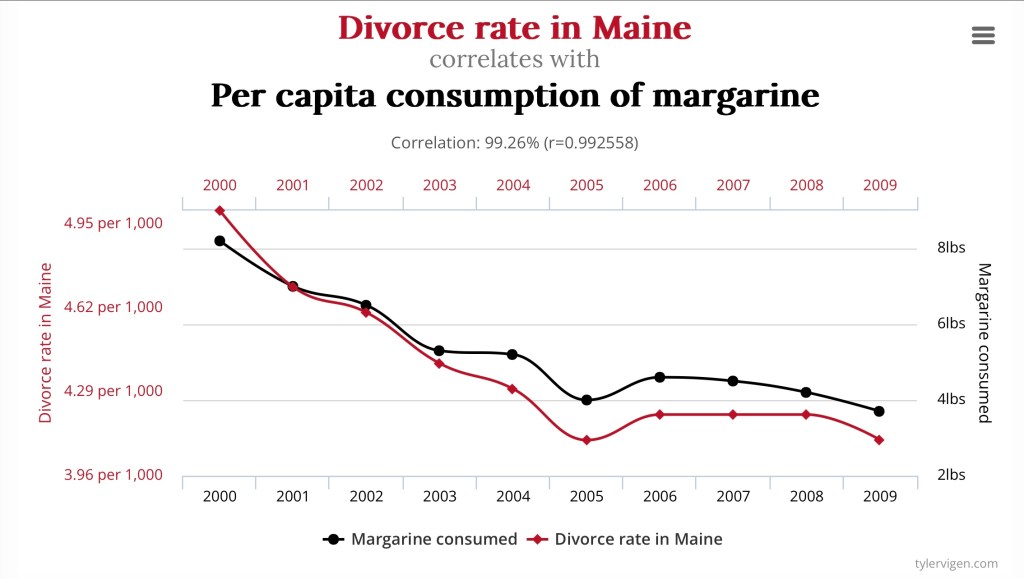
As you can see from the spurious correlations above, correlation doesn’t always imply causation. People aren’t getting divorced because they are eating more margarine (or maybe they are!). But, more often than not, correlation does indicate causation or at least you can assume that they’re related. This is helpful when you know one value, but not the other. For example, if you know a child’s height at age 6 and 8, but you don’t know the child’s height now, you can estimate the height because you know that children tend to get taller with age. It’s also helpful for forecasting and prediction. High humidity and low temperature correlate with snow fall. More about that when we get to “F is for Forecast.”

For the illustration, I went with the age-height correlation. This can be a bit confusing as kids get taller with age, but adults can shrink with age. However, this reflects what we often see in real data. Two values may be correlated at some times, but not all times. It’s okay, it’s still useful if you know the parameters.


Leave a comment