
I recently wrote a children’s book called D is for Data: The ABCs of Data Analytics. This is the first in a series of behind-the-scenes, companion articles that will dive a little deeper into each term. We’ll explore the illustration used to define the term, how the word is used in the data world, and other interesting (to me) trivia.
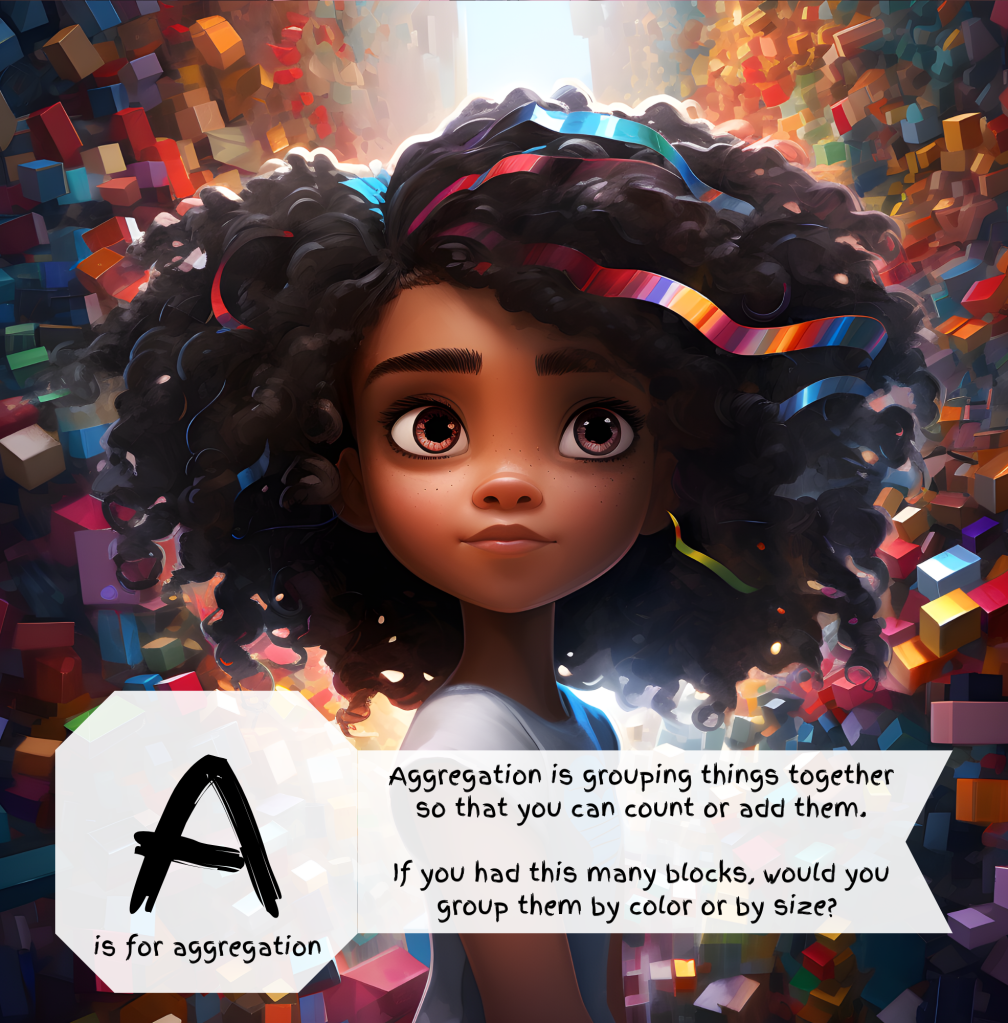
Let’s start with the illustration for aggregation. This is the same image that we see on the cover of the book. It’s an illustration of a girl framed by an explosion of building blocks. It’s difficult to look past the piercing gaze of those intelligent eyes, but the link to aggregation is the blocks. As a child and later as a father, I spent a lot of time playing with different types of building blocks. Some people can just dump all of the pieces together in a big pile and find the piece that they need amidst the chaos. Not me. I prefer to sort the blocks into different piles—either by color or shape. Placing things into different groups based on a similar characteristic like color or shape is aggregation.
Aggregation is the bread and butter of data analytics. If you want to know your daily sales, then you group by day, count orders and sum the order amount. Grouping by day means aggregating by day. Count and sum are both aggregate functions. Aggregate functions are performed on each group. So, you’d end up with a list of days and for each day, you would have the number of orders and the total dollars for all of the orders on each day. Maybe you have multiple stores and you want to change the aggregate to group by day and store. Now, you can see the detail for each store for each day. And you’re not limited to just sum and count. You can also find the average, or min, or the max value for the group. These are helpful when you want to find the largest order or smallest order or average order.
I knew going into this project that I didn’t want every kid in this book to look like my boys—although by using a midjourney hack, there is one picture that looks exactly like my boys. This book is about kids imagining themselves inside the world of data analytics. Data analytics is a wonderfully diverse world. I work with people in New Jersey and California and Texas and Arkansas and Canada and China and India and Turkey and Australia and Israel and England and Ukraine and Costa Rica. I wanted this book to reflect the diversity that I see in the data world every day. So, I have kids of all nationalities in my illustrations. And I wanted to feature girls, because my daughter is so precious to me, and so intelligent. I love the eyes of this illustration! They show both confidence and intelligence—two things that I want for my own daughter and for all of the girls that will read this book!


Leave a comment